5 Reasons for Data Storytelling in B2B PR

Particularly in the B2B and tech sectors, decision-makers are asking themselves how they can be permanently remembered. The answer: data. Data storytelling is becoming increasingly popular with the press and, consequently, with customers. Real stories based on facts and figures are the key to media success.
At first glance: The media become partners
Charts, graphs, tables or (interactive) infographics allow editors to quickly recognize whether topics and data are relevant to them. Most of the time, they look for suitable, serious information themselves in order to use it for reporting. This is where companies can score points with detailed data collection. This takes a lot of work off their shoulders. So they can concentrate on creating their own story. If the data is of interest to editors, there is nothing standing in the way of publication, whether in text or visual form. And even in the case of rejection, journalists know that companies have these data treasures and are willing to share them. In this way, media turn from contacts into partners.
Nothing but the truth – data storytelling convinces
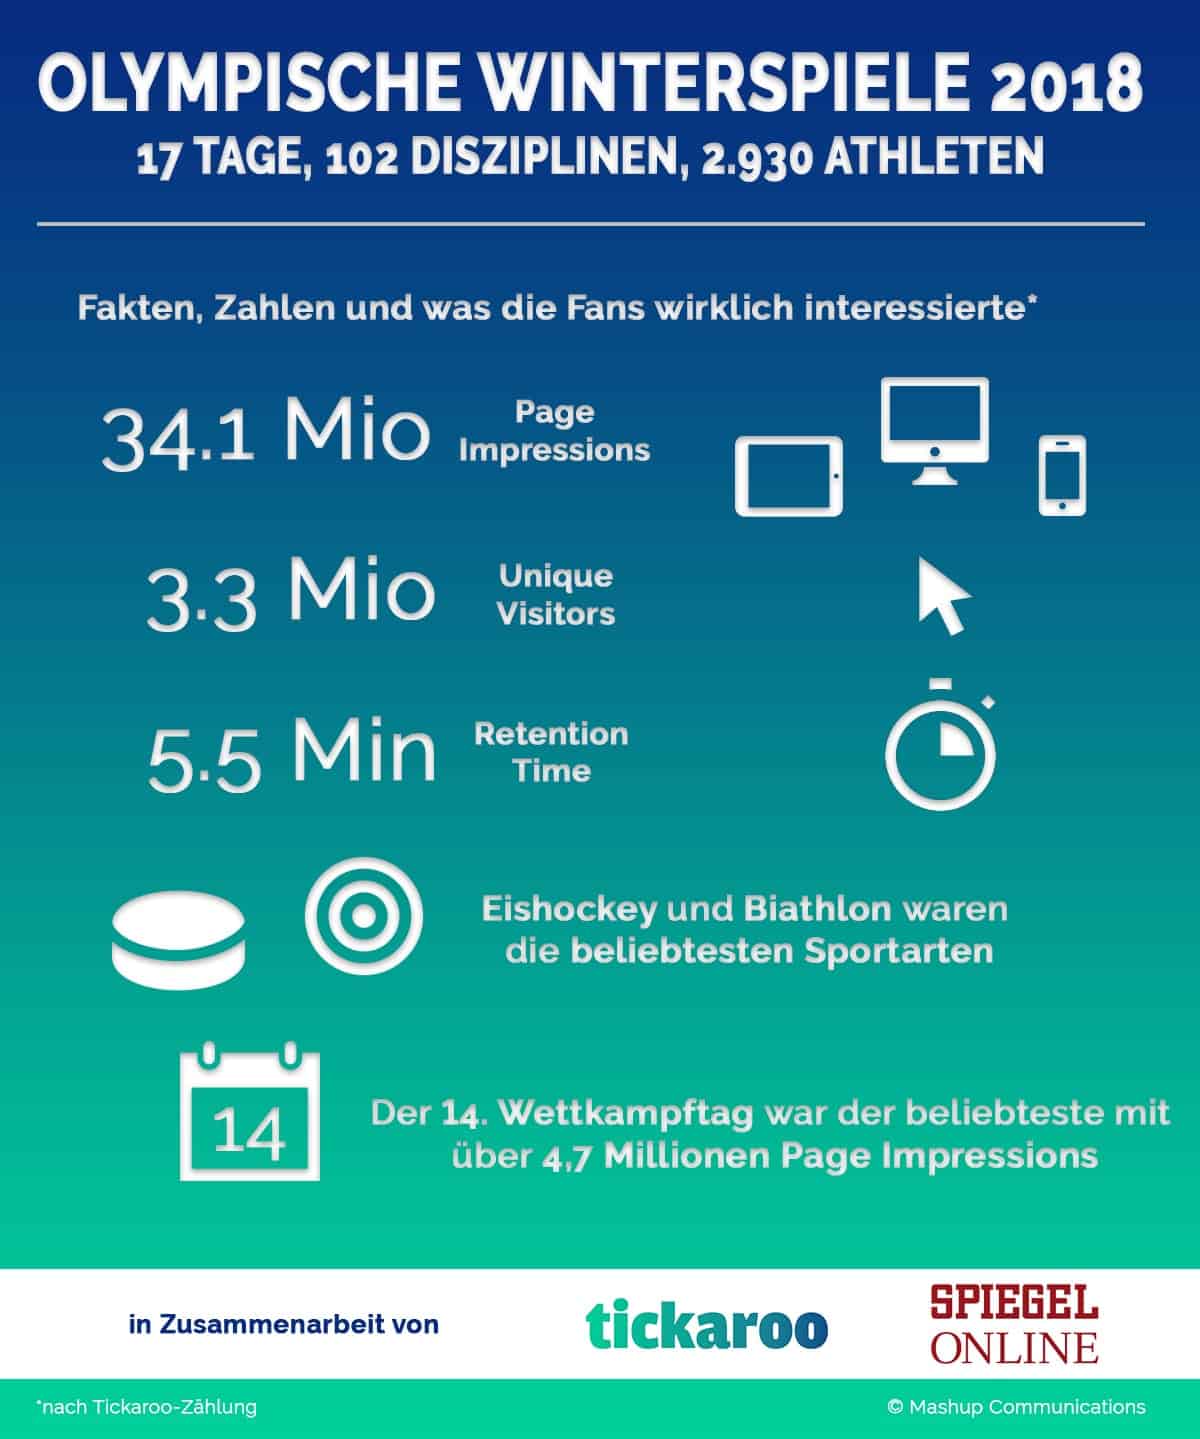
The most beautiful hero’s journey often has a catch – unverifiable information. This is where data comes in handy and provides a credible basis. From user growth to dwell times to the use of individual functions – they allow great opportunities to analyze them for internal and also external purposes. The live content platform Tickaroo was able to show how much the influence of liveblogs is gaining relevance as part of a graphic on the 2018 Olympic Games. The graphic was supplemented by the most popular sport and the competition day with the highest reach.

A special treat for any journalist: business figures. Many companies refuse to share this information transparently, even though it is available online to everyone via the Federal Gazette. In this way, companies benefit from both transparency and respectability and relieve journalists of research work.
Identify customer stories and accompany hero journeys
Data collection holds great opportunities especially for B2B technology companies. Analytical tools and mechanisms are a must-have when it comes to identifying customer stories. For example, regular surveys provide security companies with information about the extent to which data protection and digital privacy are becoming more relevant. The company is up close and personal with user developments in the area of IT security, and at the same time receives valuable data for press relations. Our customer freelancermap conducted such a user survey as part of the Freelancer Kompass. The pioneer for digital job placement presented eleven factors influencing the freelancer hourly rate.

Whether whitepaper, blogpost or webinars – the exploitation of the survey results is possible via various channels.
Reach target groups with relevant stories
Not every piece of information is exciting for every target group. Therefore, it is important to identify the really relevant facts and prepare them accordingly. In the B2B sector, an online service tends to benefit from figures on customer growth and interaction, and increases its attractiveness for potential partners. Here, too, information on business figures is considered exciting for the B2B target audience.
Improve Google ranking and generate leads – SEO
The visually prepared data material should also be available on the blog. Ideally including an iframe. This allows publishers to easily integrate the graphic into their own website. From an SEO point of view, infographics are also quite exciting due to the Google algorithm, which primarily favors visual content. When graphics are made available for download, care should be taken to provide the file name with the company name and to use a unique, short designation, something like this:
Especially in social networks, the sharing of visual content enjoys great attention, which in turn has positive effects on the SEO ranking. Consequently, this content also serves to generate leads.
Whether via an external service provider or in-house – almost every company, especially in the B2B and tech sector, has relevant data. The trick is to identify this information and prepare it in storytelling fashion. “Data is the new oil,” the saying goes, and data storytelling is simply the ideal way to tell exciting, authentic stories for customers and press relations.
Share this article


