Storytelling Case Study: Communicating socially Responsibly with Data
“Sometimes reality is too complex. Stories give it form. “Jean-Luc Godard
Data needs stories. But the reverse is also true: stories sometimes need data. This is particularly true when institutions and companies operate in the context of social developments such as the war in Ukraine or the energy crisis. For them, it is about fulfilling their social responsibility by informing the public.
There are many reasons for data storytelling in PR: It enables knowledge to be communicated in a targeted manner with a wide reach. This is illustrated by two examples from our PR practice. With the #UnterkunftUkraine initiative and the digital company resmio, we initially faced the typical hurdles of data PR: How do we get figures with news value? How do we extract knowledge from bare facts? How do we knit the findings into a data-based narrative? These were just some of the questions we had to ask ourselves again and again to turn data into stories with reach.
Arriving at Meaningful Figures
The great potential of data storytelling: it not only makes it possible to bring news to the world, but also to create news in the first place. However, the first step is to find a source for the data – and this sometimes has to be developed first. There are basically three ways in which good data storytelling can be combined.
1. Prepare Existing Figures
The obvious thing to do is to use data that every digital platform collects anyway. Anonymized usage figures can sometimes be turned into news with high social relevance. When many people fled to Germany after the start of the war of aggression in Ukraine, at least one piece of news gave cause for hope: there was a great willingness to help in Germany. Within just one week, more than 100,000 beds were offered to refugees via the #UnterkunftUkraine platform. The success story was just the beginning of the newly created digital platform and the commitment of private hosts. This meant that over the next few months, the media would repeatedly and frequently ask for facts on a daily basis. Although the raw data was generally available for #AccommodationUkraine, it was still not very meaningful without its context.
2. Collect your own Data
Collecting data for the public is a second option which, unlike using existing figures, requires more lead time. #UnterkunftUkraine teamed up with the German Center for Integration and Migration Research to gain a deeper insight into the situation and support needs of private hosts – and thus to be able to pass this on to the public. Cooperation with a research institute, from study design to report, paves the way for extensive opportunities to communicate data stories to the press.
However, it is also possible to collect your own data with less effort. This is demonstrated by the example of our customer resmio, a digital management solution for restaurateurs that is close to the businesses affected by the energy crisis. Accordingly, resmio was interested in making the situation of the catering businesses more visible. In the end, what mattered in the study design was being able to transport how strongly the energy crisis actually affected the catering industry. We also included questions from journalists at an early stage and thus had individual media on board right from the start.
3. Include External Statistics
A third source is external data that can be placed in a new context. The inclusion of figures from the Federal Statistical Office enabled us to classify the knowledge of #UnterkunftUkraine in the nationwide migration situation. External surveys from associations such as the German Hotel and Restaurant Association (Dehoga) were relevant for resmio as a supplement to its own survey results. In both cases, the use of external statistics made it possible to close existing information gaps in our own surveys and lend additional credibility to the findings.
Drawing Knowledge for Data Stories from bare Facts
The data collection is followed by the evaluation. The aim of the analysis is to reduce complexity without trivializing it. The extensive figures must first be prepared and sorted into tables and charts. Our challenge here was to generate new and surprising findings that offer a high news value.

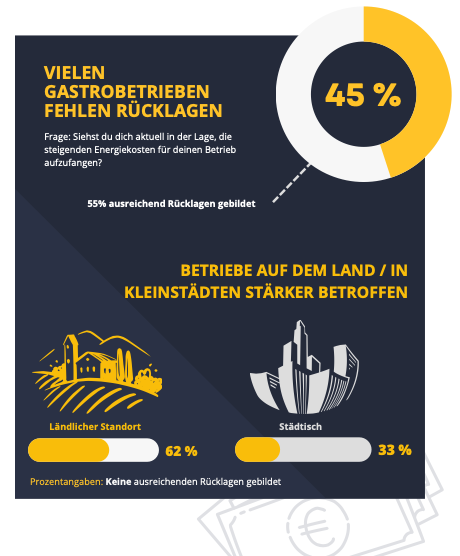
At first glance, the resmio sample showed that 45 percent of restaurateurs had not built up sufficient reserves to cover the rising costs of their business. As frightening as this news sounded, it was no longer new at the time. Only a deeper analysis and a comparison of urban and rural businesses revealed the news, which led to the headline for the PR report “Restaurant businesses in the countryside more threatened by closure than in the city”, which was picked up by Die Welt, among others, as the topic of the day.
Storytelling with Data
Data storytelling focuses on the question: What information is relevant for the target group? Readers can become protagonists if the story anticipates the audience’s next question. We compared the quantitative and qualitative results with each other.
This was possible because the #AccommodationUkraine respondents had answered both closed and open questions. The first important and quantitatively supported message emerged from the results of the closed questions: the majority of those accommodated (82%) had a positive experience of private accommodation. For readers of the data story, however, the obvious question was: What happened to the remaining part? The qualitative results of the open questions provided indirect information on this. These showed what #AccommodationUkraine hosts specifically want, so that their willingness to help would not be exhausted. A wide range of help with bureaucratic hurdles was introduced here.
Work out “Aha” Findings
The challenge of finding connections and unknown structures was immediately followed by the next. The aim was to work out these “aha” findings. Because when telling a story with data, less is more, even if all questions about the source and the time and place of the survey should be clarified at every point in the text. The same applies to the visual form of presentation. There are also some basic rules to follow here that have to do with our viewing habits.

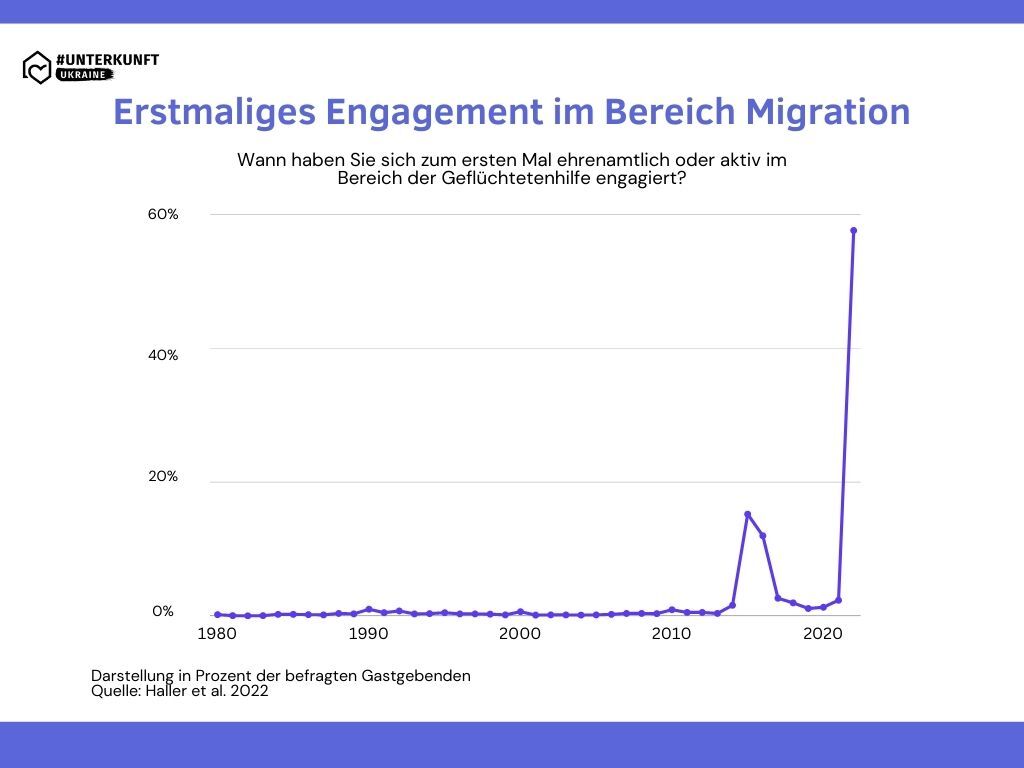
An example: We always use line charts for time progressions. A chart on first-time involvement in the area of migration thus made the strong reactivation of involvement in the area of private accommodation visible at a glance: 58% of the accommodation providers surveyed had become involved in the area of flight and asylum for the first time.

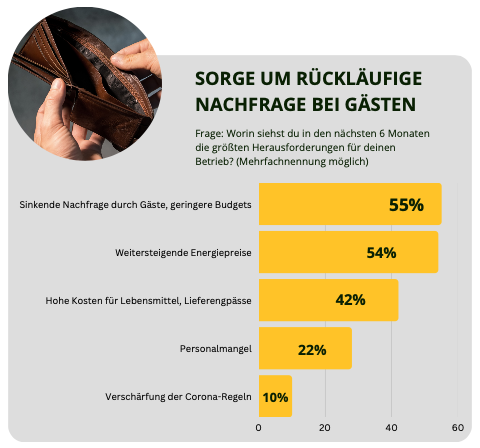
In contrast, together with resmio, we decided to highlight which challenges in the restaurant industry are among the biggest for owners. The percentage shows the ratio to the total number of respondents and thus the high importance that restaurateurs attach to the falling demand from guests. The direct comparison with other challenges can be seen at a glance with a bar chart. The graphics served journalists as visualization suggestions, which they implemented in their own layout. We provided them with the data depicted and prepared therein, along with text and diagrams.
Conclusion: Data Storytelling creates Expert Status
Thanks to rich data sources, the story of #AccommodationUkraine – closely interwoven with the engagement of private hosts – was written almost in real time and in close collaboration with the journalists who approached the initiative. Through continuous data storytelling, #AccommodationUkraine established itself in the media as a voice of the hosts, resmio as a voice of the restaurateurs. Thanks to resmio’s data stories and the targeted approach to various media, we reached a broad audience that went beyond the narrowly defined target group. However, the data stories did not just attract media attention. Both organizations also assumed social responsibility by providing answers to questions of high public interest.
Share this article


